
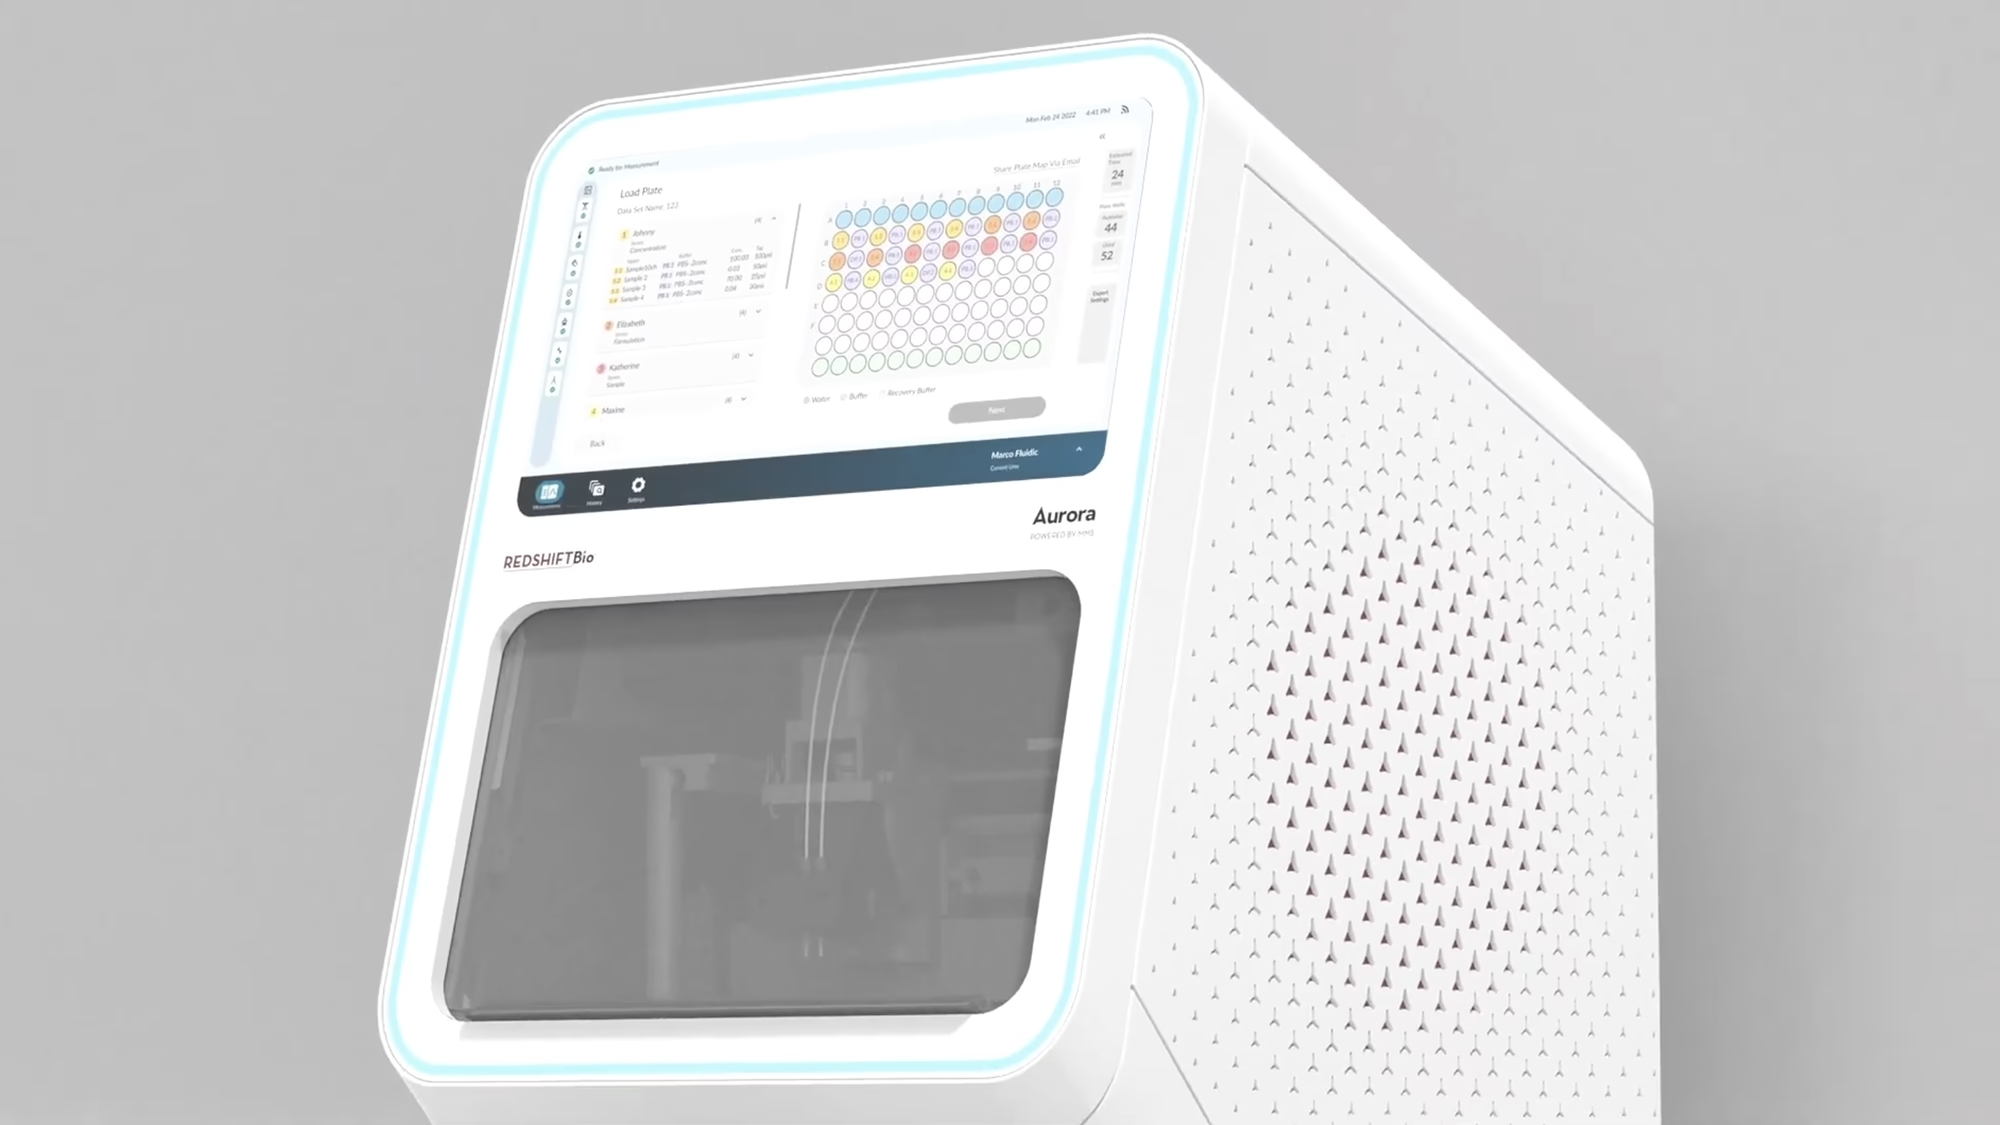
Meet Aurora TX.
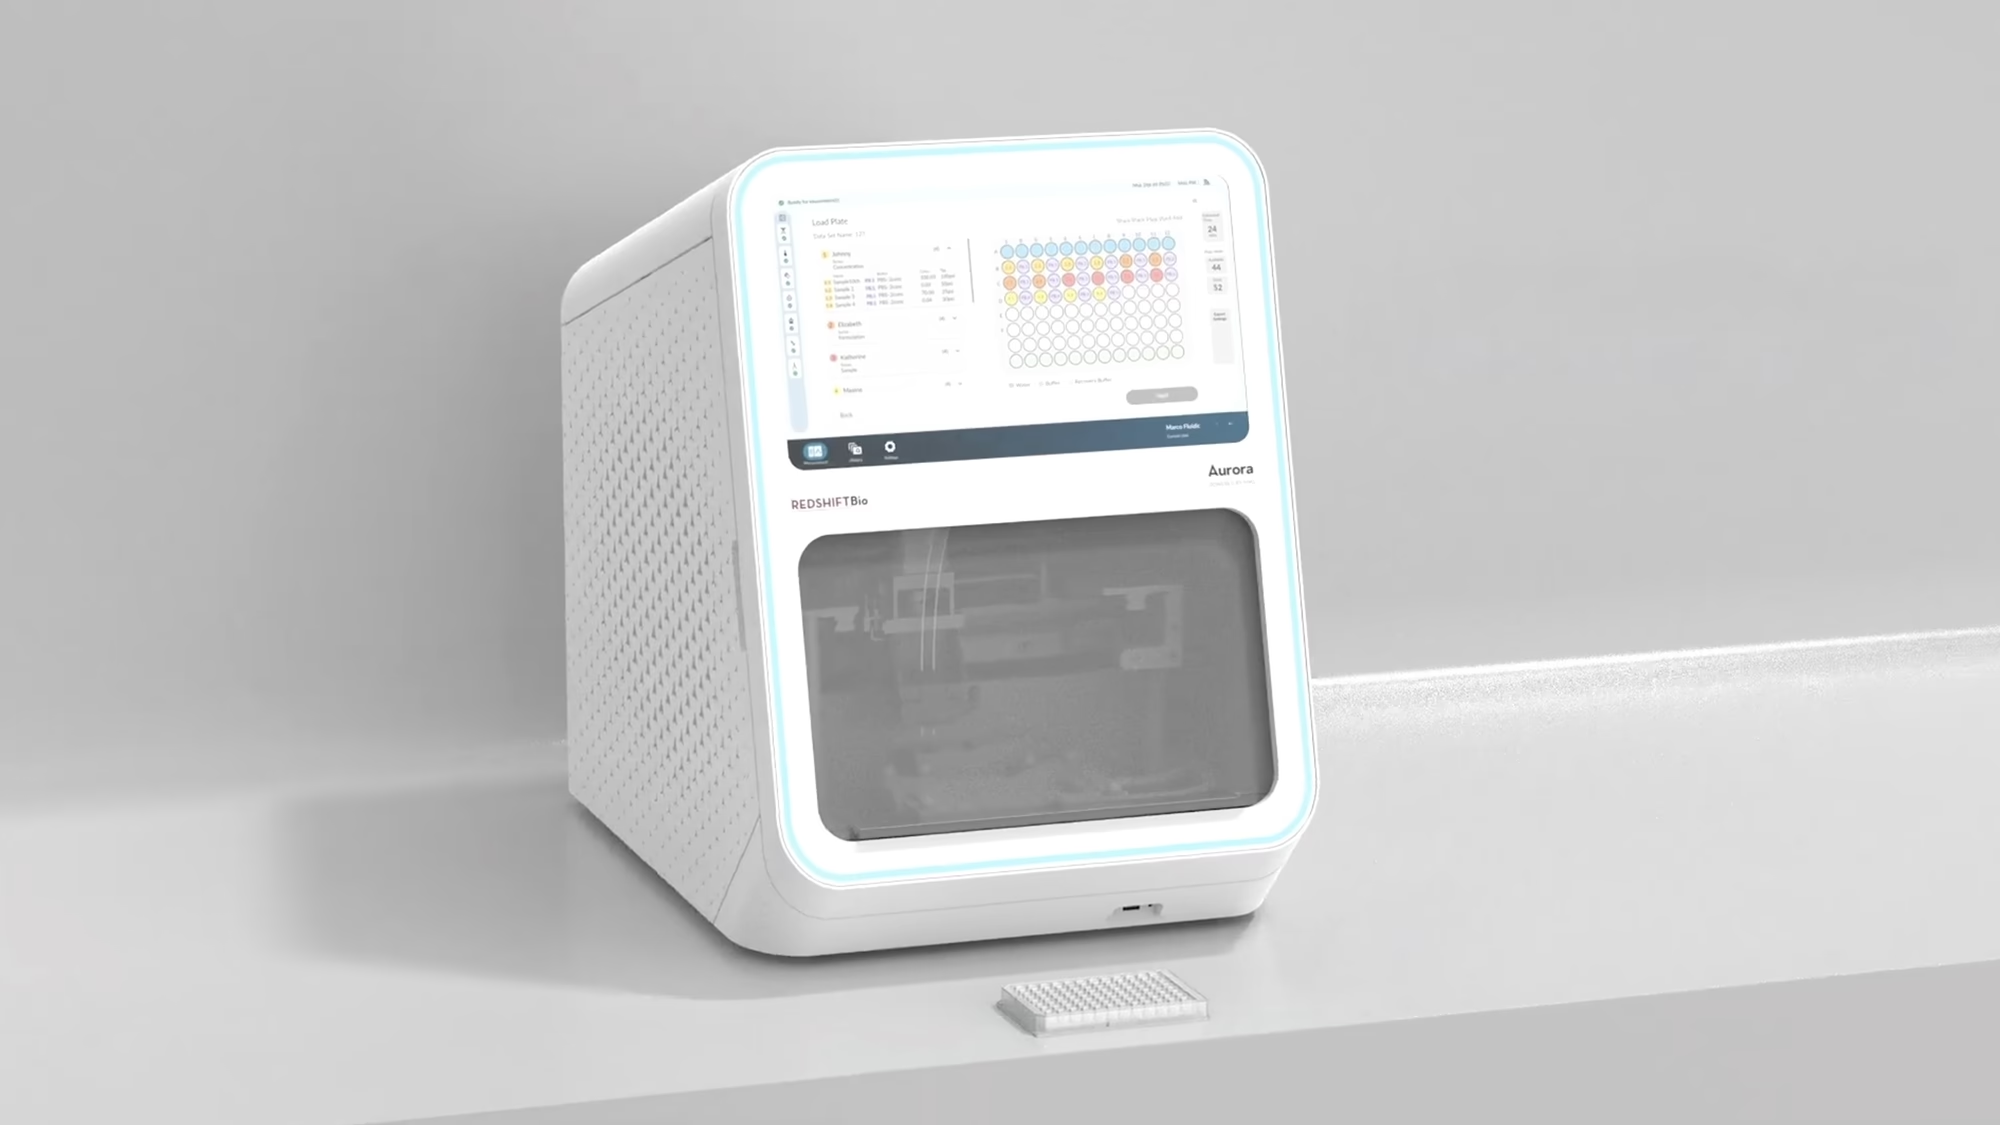
Infrared-based structure, binding and stability characterization of proteins, peptides, antibodies, RNAs, LNPs, ADCs, IDPs and more:
- Analyze directly in native buffer — no exchange, no dilution
- Detect subtle structural changes with 30X higher sensitivity than FITR and 5X CD
- Make smarter formulation and stability decisions with built-in thermal ramping
- Get ultra-clean, quantitative data with real-time background subtraction
- Trust high-precision microfluidics for reproducible results (>98%)
- Reduce training time — Aurora TX is fully automated and easy to operate
- Leverage automated data analysis through integrated software
What is MMS technology?
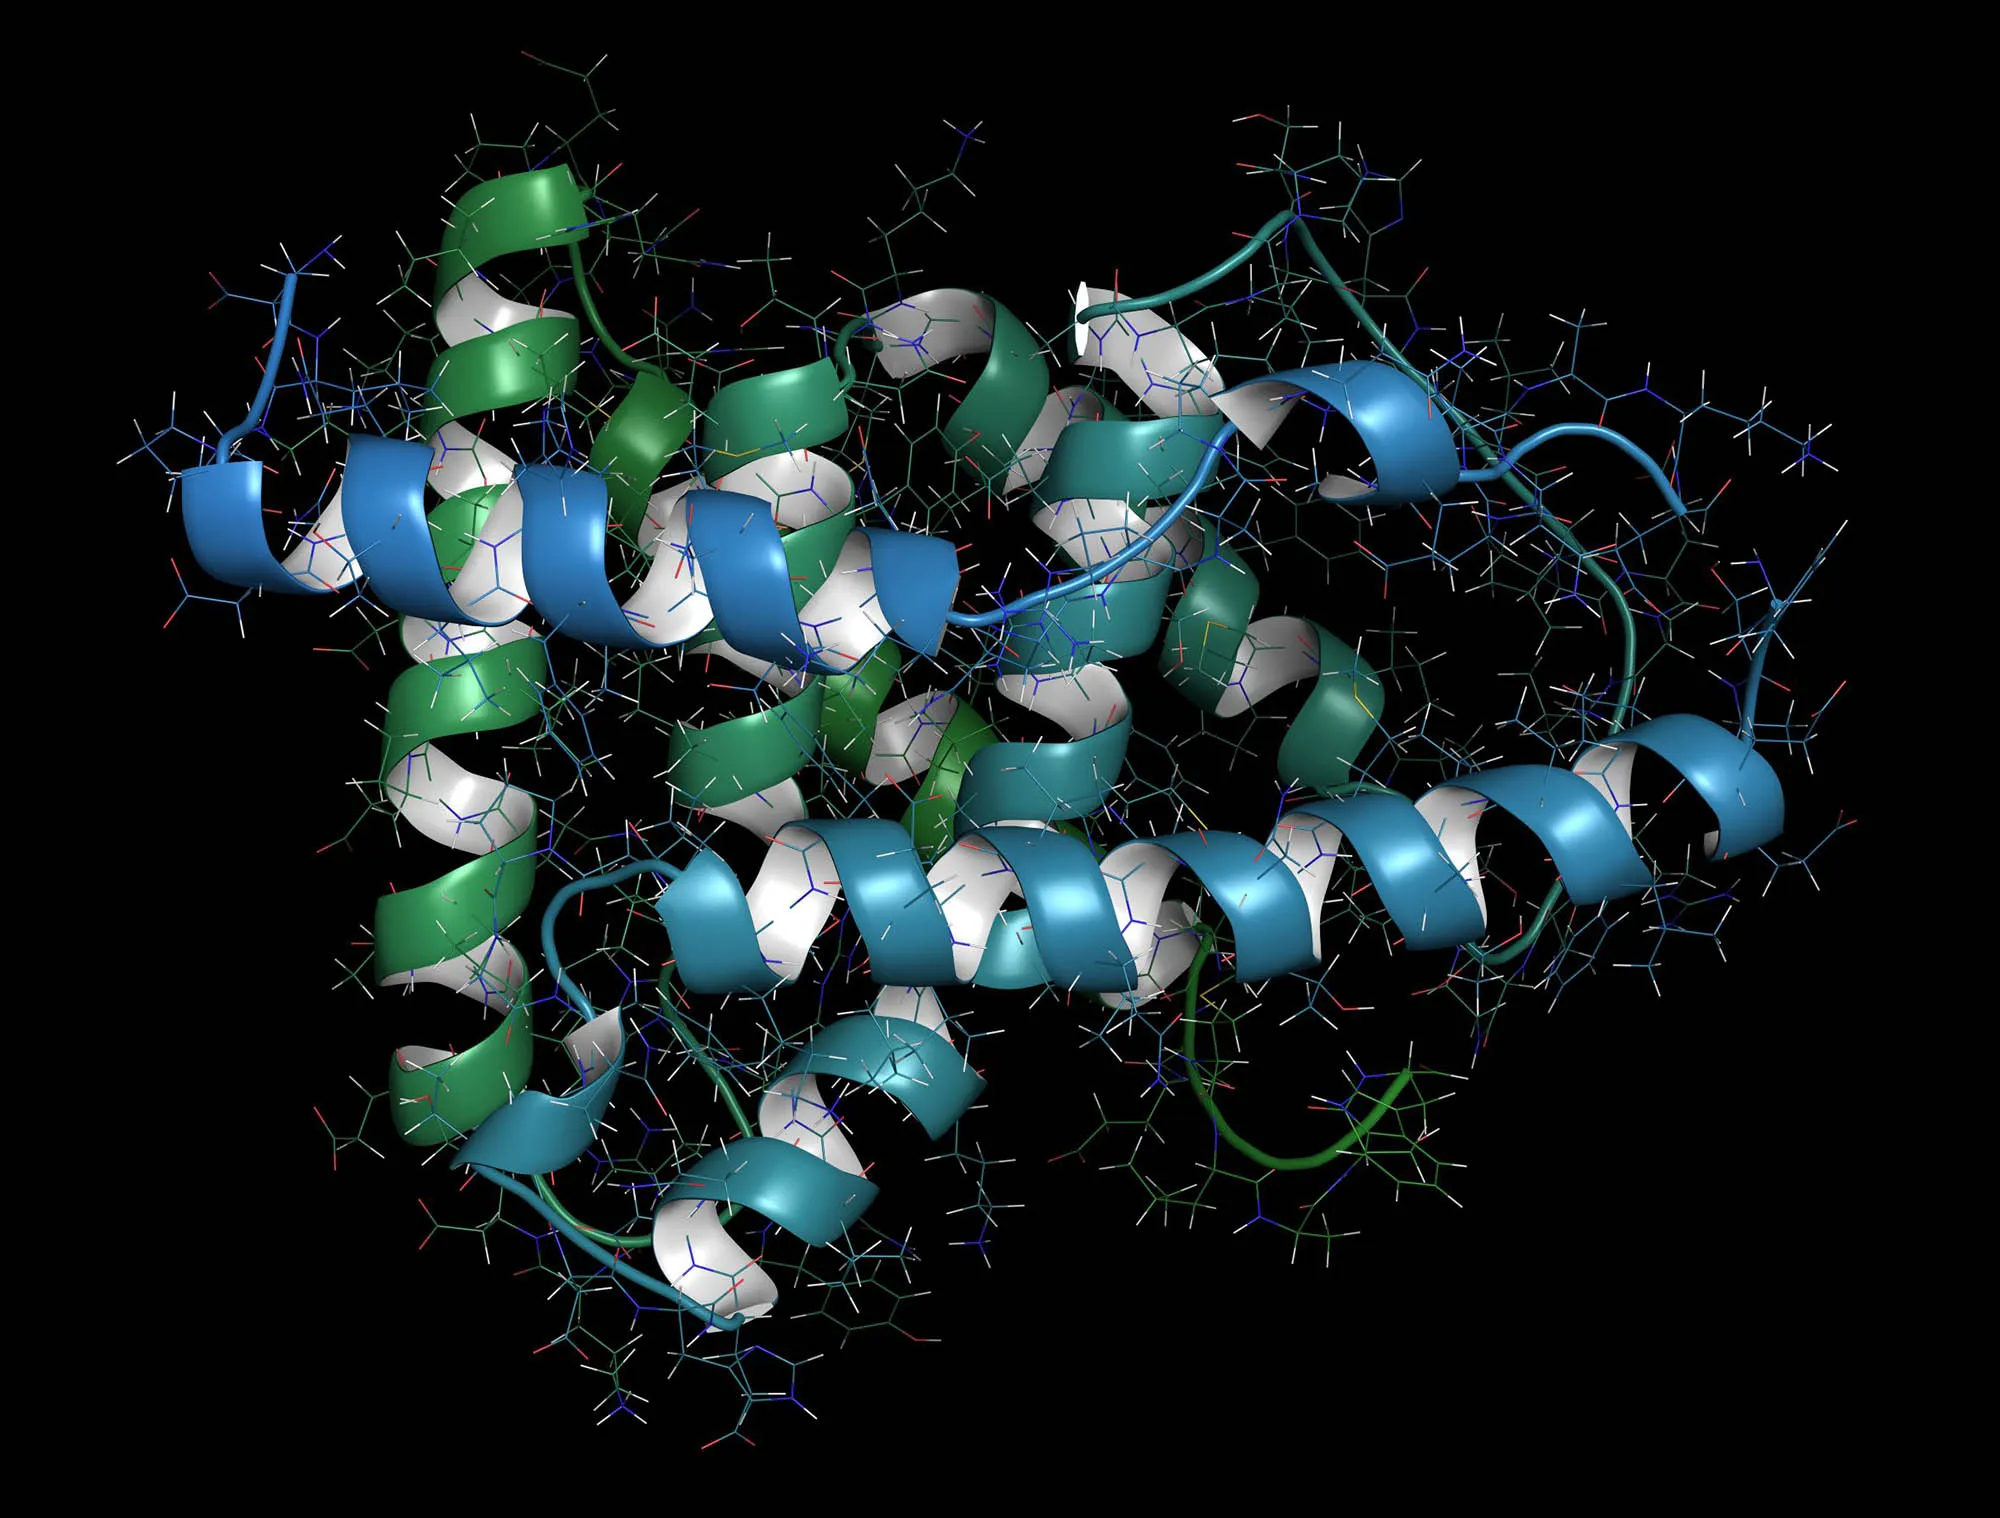
Microfluidic Modulation Spectroscopy (MMS) combines a Quantum Cascade Laser, a microfluidic flow cell, and a powerful software package to produce high-resolution secondary structure information about your biomolecules of interest.
This novel and fully-automated technique generates ultra-sensitive and precise structural measurements of your biomolecules, including proteins, peptides ,antibodies, IDPs, ADCs and binding events, such as changes to RNA structure due to ligand binding. Validate data generated through protein structure prediction or RNA structure prediction. MMS generates a high-resolution, 1 wavenumber spacing, differential absorbance spectrum across the Amide I region which is ideal for proteins and nucleic acids.
MMS directly addresses the limitations of traditional spectroscopic methods by enabling direct, label-free analysis over a wide concentration range in complex buffer formulations, without the need to buffer exchange or dilute your precious samples.
Why MMS Technology?
- Accurate and reproducible measurements across a broad concentration range from 0.1 mg/mL to >200 mg/mL.
- Real-time buffer/background subtraction enables structural analysis under relevant conditions, without needing to buffer exchange.
- High-resolution IR spectra of Amide I region.
- Walkaway automation with the convenience of a standard 96-well plate.
How MMS adds value to your research
By incorporating MMS into your suite of analytical tools, you will add the value of monitoring stability, structure, similarity, and intermolecular aggregation - all measured from a single automated run, with only one drop of sample and analyzed with a simple, state-of-the-art spectral analysis engine.
Because structure is tightly linked to function.
Even subtle structural changes can:
- Reduce biological activity
- Trigger aggregation or unwanted species
- Alter ligand binding, disrupting efficacy
- Impact safety, stability, and manufacturability
Biotherapeutics Have Evolved.
Structure Analytics Haven’t — Until Now.
What is MMS technology?
Microfluidic Modulation Spectroscopy (MMS) combines a Quantum Cascade Laser, a microfluidic flow cell, and a powerful software package to produce high-resolution secondary structure information about your biomolecules of interest.
This novel and fully-automated technique generates ultra-sensitive and precise structural measurements of your biomolecules, including proteins, peptides ,antibodies, IDPs, ADCs and binding events, such as changes to RNA structure due to ligand binding. Validate data generated through protein structure prediction or RNA structure prediction. MMS generates a high-resolution, 1 wavenumber spacing, differential absorbance spectrum across the Amide I region which is ideal for proteins and nucleic acids.
MMS directly addresses the limitations of traditional spectroscopic methods by enabling direct, label-free analysis over a wide concentration range in complex buffer formulations, without the need to buffer exchange or dilute your precious samples.
Why MMS Technology?
- Accurate and reproducible measurements across a broad concentration range from 0.1 mg/mL to >200 mg/mL.
- Real-time buffer/background subtraction enables structural analysis under relevant conditions, without needing to buffer exchange.
- High-resolution IR spectra of Amide I region.
- Walkaway automation with the convenience of a standard 96-well plate.
How MMS adds value to your research
By incorporating MMS into your suite of analytical tools, you will add the value of monitoring stability, structure, similarity, and intermolecular aggregation - all measured from a single automated run, with only one drop of sample and analyzed with a simple, state-of-the-art spectral analysis engine.

Structural Insight for Today’s Most Advanced Therapeutics
Aurora TX helps researchers understand the structure and stability of diverse molecules. These application pathways let you explore how MMS supports development, optimization, and quality assessment across modalities.


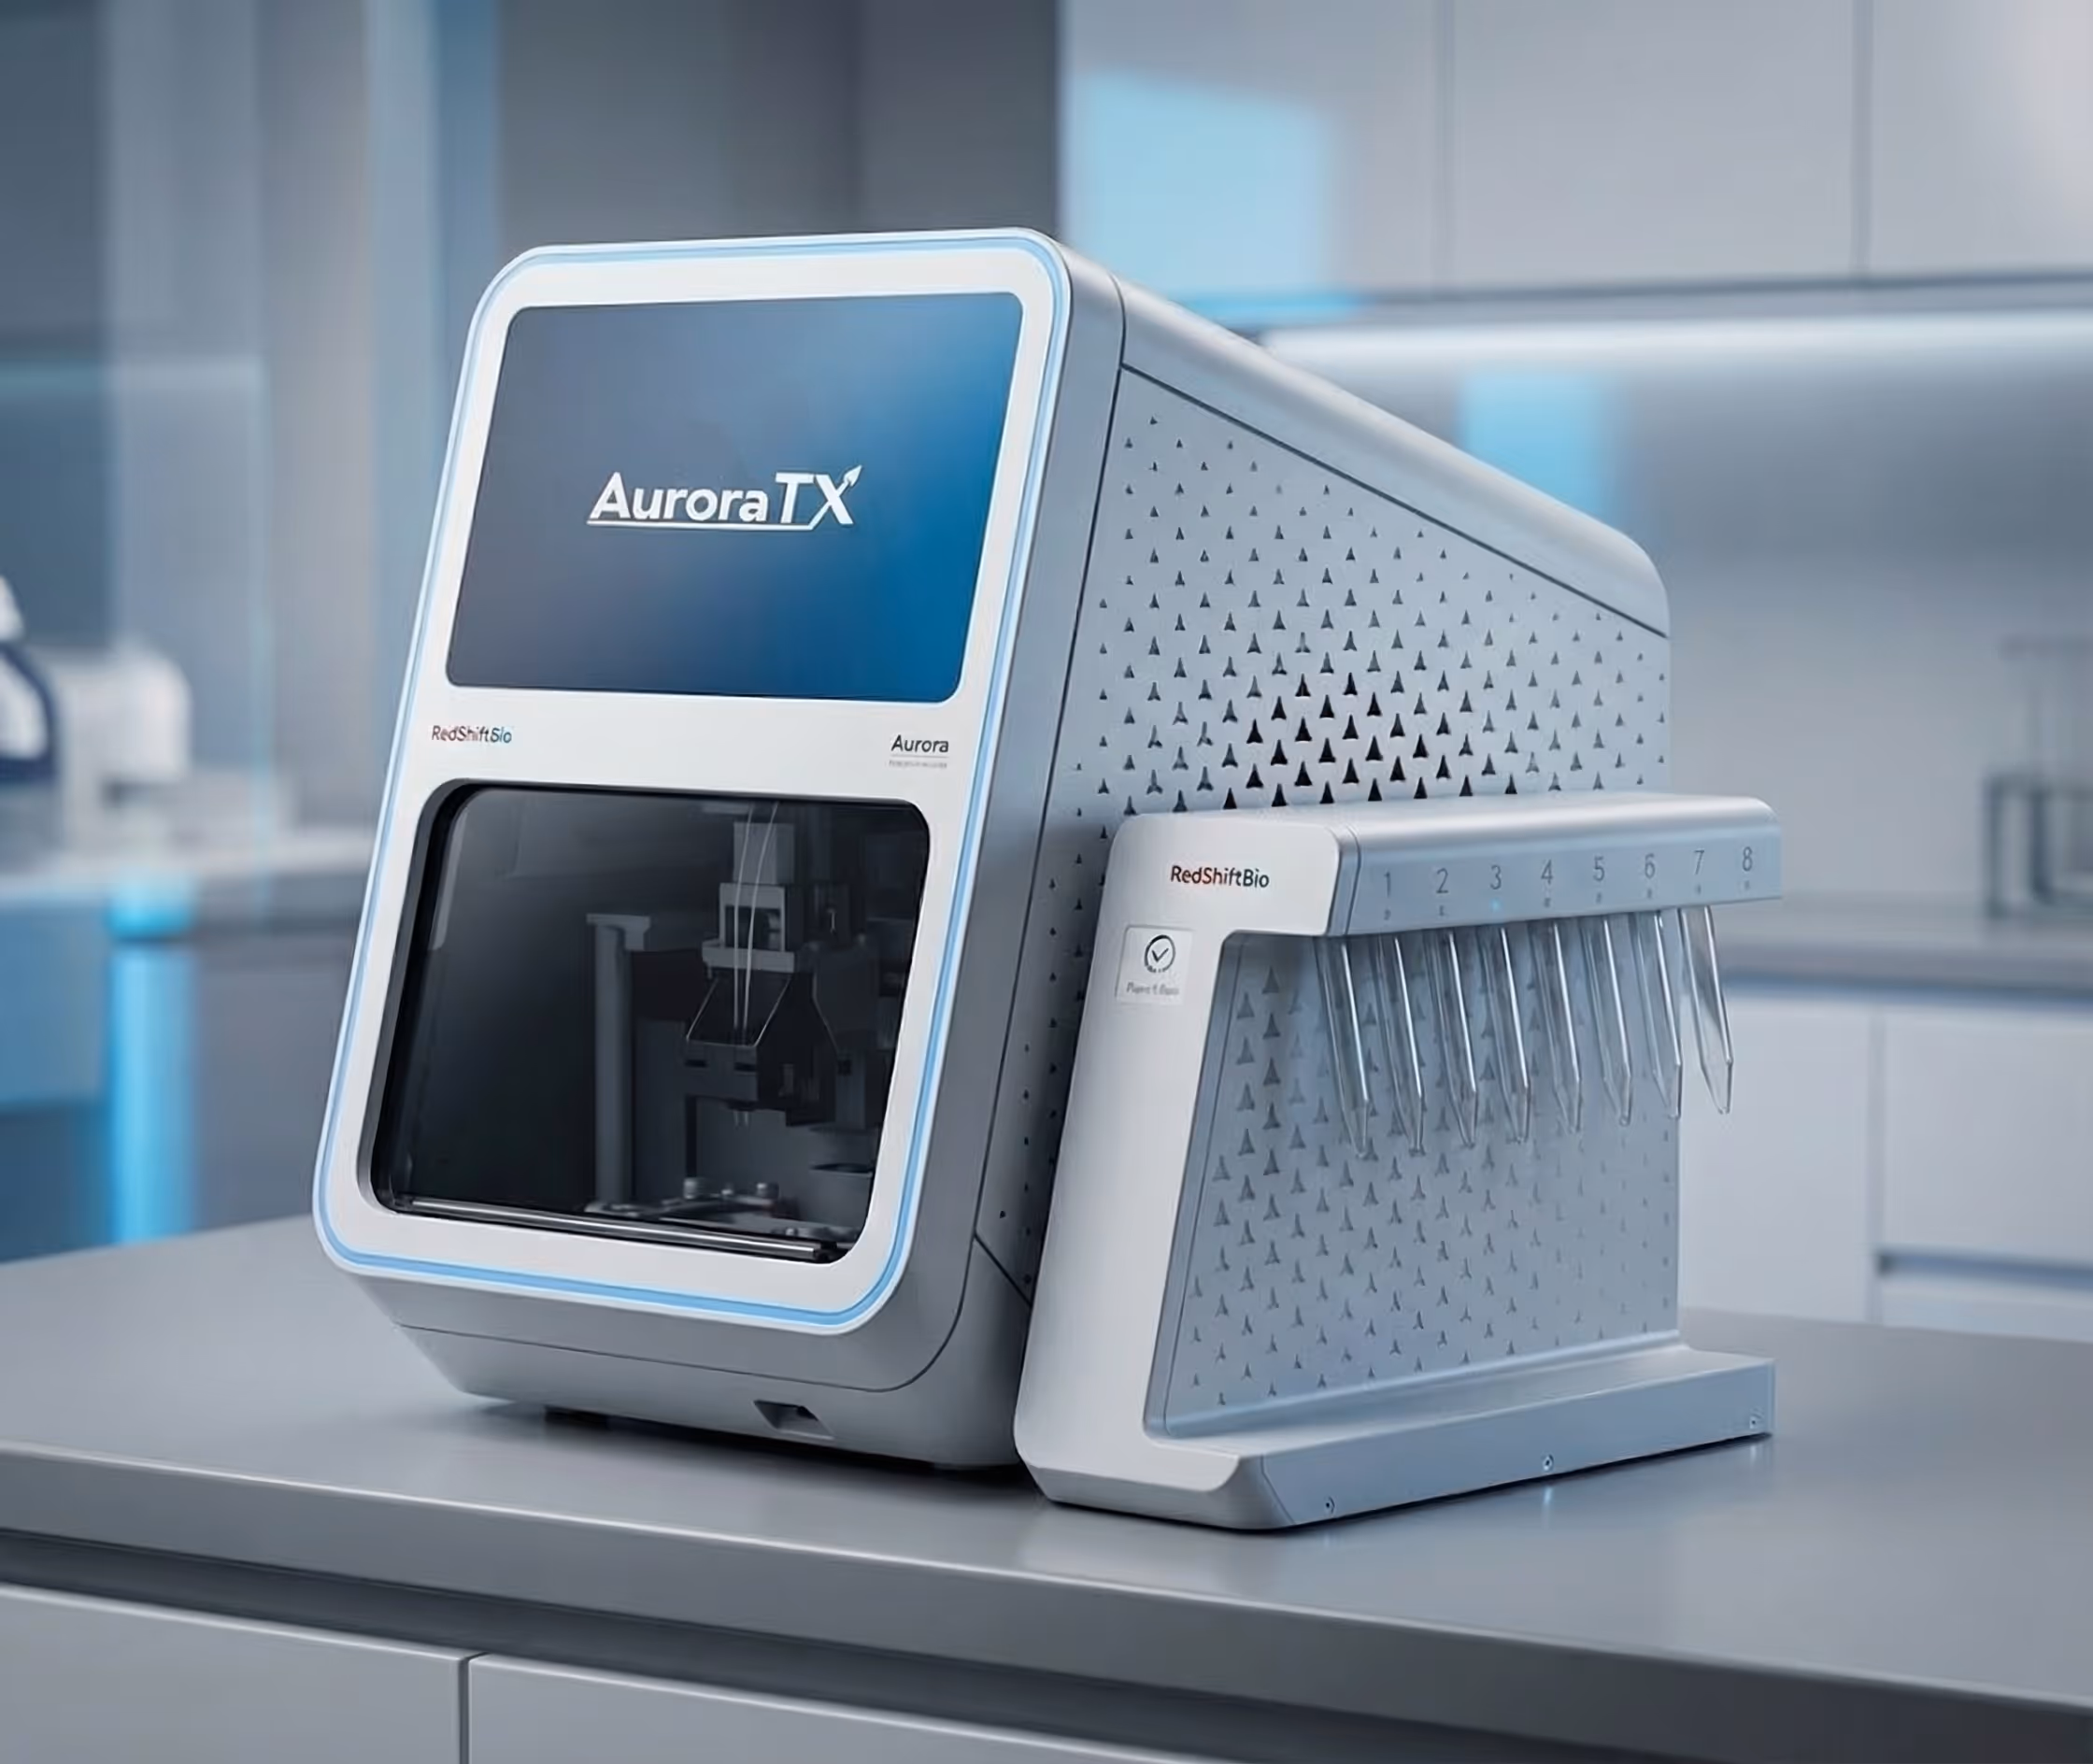
The AuroraTX Platform:
Powered by MMS
At its core, Aurora combines a high-performance quantum cascade laser, a precision-engineered microfluidic flow cell, and automated spectral analytics to deliver high-resolution structural insight.
By eliminating buffer exchange, dilution, and the need for spectroscopy expertise, MMS overcomes the core limitations of traditional techniques and makes label-free structural analysis easy — even in the most complex formulations.
What is MMS technology?
Microfluidic Modulation Spectroscopy (MMS) combines a Quantum Cascade Laser, a microfluidic flow cell, and a powerful software package to produce high-resolution secondary structure information about your biomolecules of interest.
This novel and fully-automated technique generates ultra-sensitive and precise structural measurements of your biomolecules, including proteins, peptides ,antibodies, IDPs, ADCs and binding events, such as changes to RNA structure due to ligand binding. Validate data generated through protein structure prediction or RNA structure prediction. MMS generates a high-resolution, 1 wavenumber spacing, differential absorbance spectrum across the Amide I region which is ideal for proteins and nucleic acids.
MMS directly addresses the limitations of traditional spectroscopic methods by enabling direct, label-free analysis over a wide concentration range in complex buffer formulations, without the need to buffer exchange or dilute your precious samples.
Why MMS Technology?
- Accurate and reproducible measurements across a broad concentration range from 0.1 mg/mL to >200 mg/mL.
- Real-time buffer/background subtraction enables structural analysis under relevant conditions, without needing to buffer exchange.
- High-resolution IR spectra of Amide I region.
- Walkaway automation with the convenience of a standard 96-well plate.
How MMS adds value to your research
By incorporating MMS into your suite of analytical tools, you will add the value of monitoring stability, structure, similarity, and intermolecular aggregation - all measured from a single automated run, with only one drop of sample and analyzed with a simple, state-of-the-art spectral analysis engine.
Related MMS Resources
Frequently Asked Questions
Are there benefits to using absorption methods such as MMS, FTIR or CD complementary to scattering methods like DLS?
Yes! In addition to particle sizes interrogated with DLS, absorption methods provide fundamental structural insights. In the case of proteins, this helps to understand underlying mechanisms that may stabilize or destabilize protein formulations, for example as a response to external stresses or in course of binding events.
How does circular dichroism compare to MMS as a protein spectroscopy technique?
Both circular dichroism (CD) and MMS are spectroscopic techniques that measure protein secondary structures. Both these techniques are known for their high sensitivities and the ability to provide accurate assessment of the secondary structures. These techniques differ by their principles. Because proteins are chiral molecules, they interact with circularly polarized light, and the different secondary structures in protein give rise to differential absorbance upon interactions with left-handed and right-handed polarized light. CD uses this principle to detect the different secondary structures in proteins. MMS on the other hand, probes the vibrational responses of the backbone carbonyl groups of the protein. For CD, the signal quality depends on the total absorbance of a sample. Because of this limitation, the concentration range for CD is narrow (0.01-1 mg/mL) and the buffer compatibility is poor. In contrast, because MMS uses IR spectroscopy and allows for real-time buffer subtraction, it allows a wide range of absorbance and is not limited by buffer signals. MMS can measure samples at a wide concentration range (0.1-200 mg/mL) and is compatible with most buffers and excipients. A direct comparison between CD, FTIR and MMS is given in this application note:
Why is it important to use spectroscopy to measure protein concentration alongside protein structure?
Other than providing structural information about the proteins, spectroscopy allows a quick and easy way to quantify protein concentration using the Beer-Lambert Law, or Beer’s Law. For proteins in solution, Beer’s Law states that when light passes through the solution, the absorbance is proportional to the concentration of the protein, given that the optical path length and the absorptivity of the protein stay constant. This gives spectroscopic techniques advantages to not only analyze protein structures but also provide accurate quantification of protein concentrations.
How does Fourier Transform Infrared compare to MMS as a protein spectroscopy technique?
Fourier Transform Infrared (FTIR) and MMS are both IR-based spectroscopic techniques, meaning that the way they probe the proteins (backbone carbonyl groups) is the same. Therefore, both techniques measure the secondary structure of proteins. The main differences between FTIR and MMS are the sensitivity and concentration range. With the high-power quantum cascade and the microfluidic flow cell that allows for real-time buffer subtraction, MMS largely improves the signal-to-noise ratio and provides 30x sensitivity compared to FTIR (Kendrick, B. S.; Gabrielson, J. P.; Solsberg, C. W.; Ma, E.; Wang, L. Determining Spectroscopic Quantitation Limits for Misfolded Structures. Journal of Pharmaceutical Sciences 2020, 109 (1), 933–936. https://doi.org/10.1016/j.xphs.2019.09.004).
Typically, FTIR requires high concentration of proteins (10 mg/mL) for measurements, but MMS can measure proteins at a range from 0.1 to >200 mg/mL. In addition, compared to FTIR’s manual workflows, MMS is a fully automated technique. An entire workflow from high throughput (up to 96-well plate) sample measurement to cleaning, baselining, and data analysis can be done with a single mouse click using MMS.