Microfluidic Modulation Spectroscopy:
High-resolution structural insights from just 50 µL of sample.
Traditional tools weren’t built for today’s biotherapeutics or today’s buffers, especially in high-excipient, formulation-grade conditions where key signals can get buried and subtle shifts go unnoticed.
Microfluidic modulation spectroscopy (MMS) gets you highly sensitive and quantitative structural measurements across proteins, peptides, and RNAs — even in the most challenging buffers.
As an infrared-based technique, MMS reveals early structural changes that legacy methods often miss, while also capturing information on concentration, melting temperature, stability, aggregation, and similarity — all in a single automated run.
If your technique can’t see the shift, it can’t save you from its impact.
Aurora TX is the platform built to rewrite how you see and control structural risk.
See How MMS Compares With DSF
- Resolve multiple thermal transitions with structural context
- Distinguish unfolding from aggregation events
- Quantify structural changes throughout thermal ramp
- Uncover instability earlier and with greater clarity
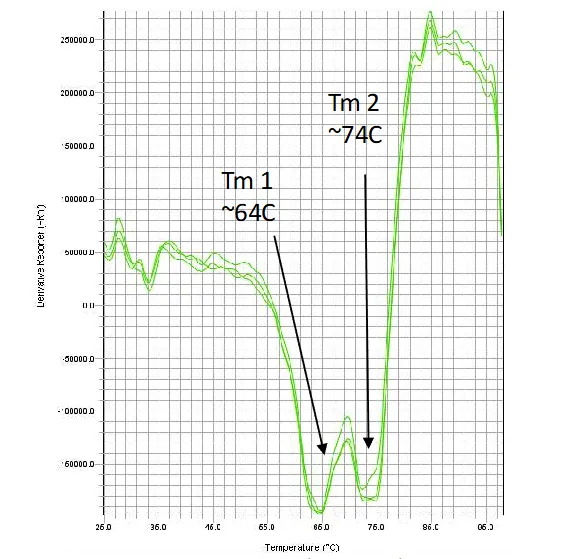
Melt data using Sypro orange
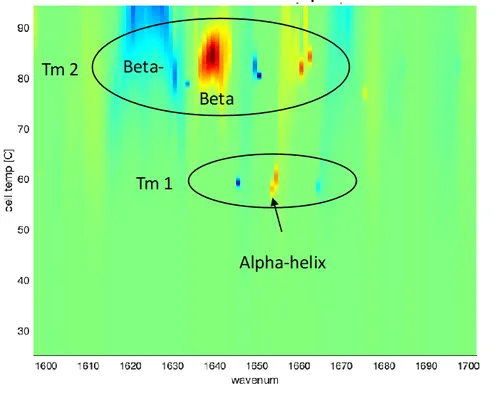
MMS 2D melt map
Ovalbumin
Where MMS Fits in Your Workflow
Development
Track structural shifts during in-process and formulation steps, stability studies, and stress testing — so you can optimize conditions and anticipate issues earlier in development.
Characterization
Compare higher-order structure, detect aggregation pathways, monitor ligand-induced conformational changes, and generate detailed melt profiles for deeper biophysical insight.
QC/CMC
Assess batch-to-batch reproducibility and manufacturability, giving you quantitative structural fingerprints that support consistent and scalable production.
MMS vs Traditional Structure and Stability Tools
| Method | Structural Changes | Thermal Stability | Sample Volume (µL) | Throughput (samples/day) | Buffer Compatibility | Data Quality | Ease of Use |
|---|---|---|---|---|---|---|---|
MMS (Aurora TX) | ✓ | ✓ | 50 | Medium-High | Wide-ranging; native/formulation buffers | Quantitative; reproducible | Easy; automated workflow |
FTIR | ✓ | X | 20–100 | Low | Requires low-water, low-excipient, low-salt buffers | Semi-quantitative; lower resolution | Difficult; requires method dev |
CD | ✓ | X | 100–500 | Medium-High | Requires low-salt, clean buffers | Qualitative; deconvolution-limited | Manual; requires expertise |
DSF | X | ✓ | 10–40 | High | Requires low-salt, clean buffers | Semi-quantitative; indirect measurement | Easy but dye-dependent |
DSC | X | ✓ | 300–700 | Low | Requires a flat Cp(T) profile; tightly matched compositions | Quantitative; thermodynamic transitions only | Manual; requires expertise |
Related MMS Resources
Frequently Asked Questions
Are there benefits to using absorption methods such as MMS, FTIR or CD complementary to scattering methods like DLS?
Yes! In addition to particle sizes interrogated with DLS, absorption methods provide fundamental structural insights. In the case of proteins, this helps to understand underlying mechanisms that may stabilize or destabilize protein formulations, for example as a response to external stresses or in course of binding events.
How does circular dichroism compare to MMS as a protein spectroscopy technique?
Both circular dichroism (CD) and MMS are spectroscopic techniques that measure protein secondary structures. Both these techniques are known for their high sensitivities and the ability to provide accurate assessment of the secondary structures. These techniques differ by their principles. Because proteins are chiral molecules, they interact with circularly polarized light, and the different secondary structures in protein give rise to differential absorbance upon interactions with left-handed and right-handed polarized light. CD uses this principle to detect the different secondary structures in proteins. MMS on the other hand, probes the vibrational responses of the backbone carbonyl groups of the protein. For CD, the signal quality depends on the total absorbance of a sample. Because of this limitation, the concentration range for CD is narrow (0.01-1 mg/mL) and the buffer compatibility is poor. In contrast, because MMS uses IR spectroscopy and allows for real-time buffer subtraction, it allows a wide range of absorbance and is not limited by buffer signals. MMS can measure samples at a wide concentration range (0.1-200 mg/mL) and is compatible with most buffers and excipients. A direct comparison between CD, FTIR and MMS is given in this application note:
Why is it important to use spectroscopy to measure protein concentration alongside protein structure?
Other than providing structural information about the proteins, spectroscopy allows a quick and easy way to quantify protein concentration using the Beer-Lambert Law, or Beer’s Law. For proteins in solution, Beer’s Law states that when light passes through the solution, the absorbance is proportional to the concentration of the protein, given that the optical path length and the absorptivity of the protein stay constant. This gives spectroscopic techniques advantages to not only analyze protein structures but also provide accurate quantification of protein concentrations.
How does Fourier Transform Infrared compare to MMS as a protein spectroscopy technique?
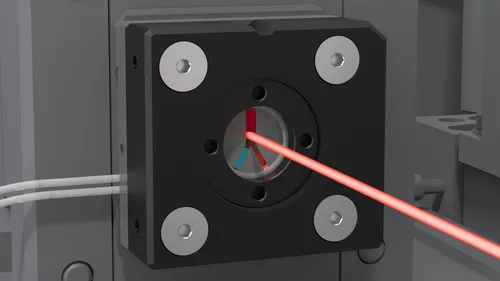
Fourier Transform Infrared (FTIR) and MMS are both IR-based spectroscopic techniques, meaning that the way they probe the proteins (backbone carbonyl groups) is the same. Therefore, both techniques measure the secondary structure of proteins. The main differences between FTIR and MMS are the sensitivity and concentration range. With the high-power quantum cascade and the microfluidic flow cell that allows for real-time buffer subtraction, MMS largely improves the signal-to-noise ratio and provides 30x sensitivity compared to FTIR (Kendrick, B. S.; Gabrielson, J. P.; Solsberg, C. W.; Ma, E.; Wang, L. Determining Spectroscopic Quantitation Limits for Misfolded Structures. Journal of Pharmaceutical Sciences 2020, 109 (1), 933–936. https://doi.org/10.1016/j.xphs.2019.09.004).
Typically, FTIR requires high concentration of proteins (10 mg/mL) for measurements, but MMS can measure proteins at a range from 0.1 to >200 mg/mL. In addition, compared to FTIR’s manual workflows, MMS is a fully automated technique. An entire workflow from high throughput (up to 96-well plate) sample measurement to cleaning, baselining, and data analysis can be done with a single mouse click using MMS.