Protein Structure Analysis
Protein Secondary Structure Analysis with MMS
The overall structural make-up of a protein biomolecule is complex and governed by folding, intramolecular, and intermolecular interactions. Repetitive patterns allow the identification of structural populations and monitoring the presence and changes in these structural populations reveals important information relating to the stability and ultimately the safety and efficacy of a biotherapeutic. The most common structures that are important in the characterization of folded proteins include parallel and anti-parallel beta sheets, alpha-helices, turns, and unordered structures. By tracking relative amounts of these components and comparing them to known reference materials, it is possible to gain confidence in the integrity of a biotherapeutic as well as identify undesired changes in functionality that will be critical to control and remedy at all stages in the development and formulation workflows.
Why Protein Structure Matters in Drug Development
Analysis of secondary structure in proteins using Infrared spectroscopy has a long tradition and is a well-accepted industry practice. At first glance, a typical IR spectrum focusing on the Amide I region appears broad, so extraction of useful information requires spectral enhancement. One process of extracting secondary structure information from a spectrum typically involves a band narrowing and curve fitting approach. For instance, Fourier self-deconvolution curve fitting, and partial least squares analysis are two well-known approaches. However, second derivative analysis is the most prominent method used and is the method employed in the delta software package.
Techniques for Secondary Structure Characterization
Since the various structural components of the Amide I spectrum absorb at a range of wavelengths (Table 1), the Amide I band tends to be broad. The goal of a band fitting approach is to deconvolute the Amide I band into the various component bands which can then be assigned to the different types of secondary structure. A band narrowing step is first necessary to assign the relevant bands and can be performed by either a second derivative analysis or by Fourier deconvolution.
Example: Structural Analysis of Antibodies and Peptides

An example of Gaussian curve fitting can be seen in Figure 1 where the red line represents the inverted and baselined second derivative spectrum of an antibody, and the colored gaussian curves represent the deconvoluted contributions of each spectral feature as outlined in Table 1.

The advantage of using Microfluidic Modulation Spectroscopy (MMS) powered by the AQS³ delta software to elucidate the structural composition of a protein therapeutic is that it is intuitive and easy to specify the populations that should be monitored. Post-analysis processing gives clear and meaningful results to show which secondary structural motifs have been maintained and which may have been compromised due to changes in experimental or formulation conditions.

HOS analysis of four insulin samples tested at different pH and demonstrating an increase in alpha-helical structures with an increase in pH. Application Note Using Microfluidic Modulation Spectroscopy to determine the Structural Effect of pH on the Peptide Hormone Insulin.
Related Products for Structural Analysis

FAQs About Protein Structure and Secondary Structural Changes
Why is protein structure important?
Protein structure in general is important for the protein function/ activity on the one hand and stability/ aggregation tendency on the other hand. Both the global protein structure, and 3D arrangement as well as local structural motifs and interactions determine those protein properties.
Resources:
Protein Analysis Tools: Higher Order Structure of Insulin | RedShiftBio
Using MMS to Measure Buffer-Induced Structural Changes in an Alpha-helix Rich Enzyme| RedShiftBio
Measuring Buffer-Induced Structural Changes in a Beta-sheet Rich Protein using MMS |RedShiftBio
What are the levels of protein structure characterization?
Characterization of protein structure can be separated into four structural levels, namely primary, secondary, tertiary, and quaternary protein structure. Primary protein structure determines the sequence of amino acids within a protein. The other levels describe the higher-order structure (HOS) of a protein. The local protein structure, mostly comprising a part of its sequence, is called secondary structure. Tertiary structure is the 3D arrangement of a protein, consisting of several secondary structural components within one amino acid sequence. The 3D arrangement of protein structures that include more than one sequence is called quaternary structure. The figure below provides an overview on the different levels of protein structure using proliferating cell n (PCNA) as an example:
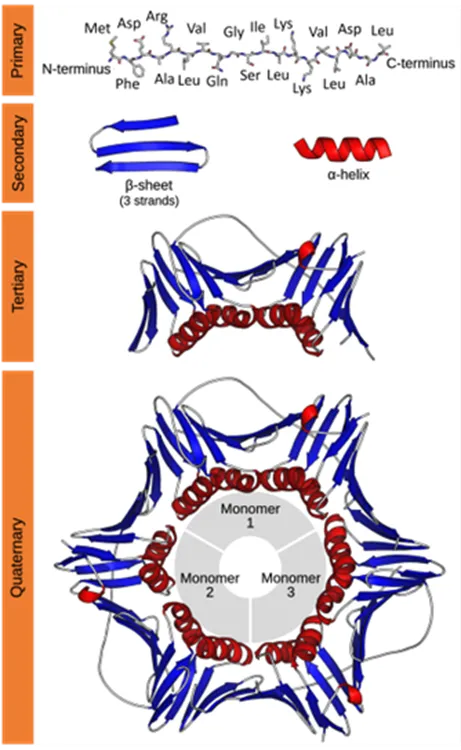
Figure from: Images by By Thomas Shafee - Own work, CC BY 4.0, (https://commons.wikimedia.org/w/index.php?curid=52821068)
How does protein sequencing differ from measurement of protein higher order structure?
Protein sequencing provides the sequence of amino acids within one protein while measurements of protein higher order structure provide the protein’s 3D arrangement either locally (secondary) or globally (tertiary and quaternary).
What does the term secondary structure refer to?
Secondary protein structure refers to the local structure of individual parts of the protein sequence. It is driven by intra- and intermolecular interaction of the protein. Typical protein secondary structural motifs are α-helix, parallel and antiparallel β-sheet, turn, and random coil. Usually, proteins consist of several secondary structural components which build up their tertiary structure.
What are some benefits of measuring secondary structure compared with the other levels of protein structure?
Secondary structure provides direct access to the protein’s function and stability since the global protein structure and shape are closely related to the relative abundance of secondary structural motifs. Changes in the global properties of the protein are often accompanied by secondary structural change. Compared to tertiary and quaternary protein structures which require high experimental effort, secondary protein structure is comparably easy to access, for example through vibrational spectroscopy. On the other hand, secondary protein structure also serves as an ideal reporter on local structural changes, e.g. through binding events or the onset of protein structural aggregation processes.
What do changes in secondary structure tell us about a protein?
As secondary structure predicts the tertiary structure of a protein, changes in secondary structure, i.e., alpha-helix and beta-sheet, can lead to drastic changes in the protein globular structure, thereby affecting the function or activity of the protein. Additionally, the secondary structure is a key determinant of protein aggregation. The tendency of forming beta-sheets from a primary sequence dictates the likelihood of aggregate formation. Conversely, sequences with a high tendency of forming alpha helices are less likely to form aggregates. (Uversky, et al. Protein Misfolding, Aggregation, and Conformational Diseases. In Protein Reviews; Springer, 2006; Vol. 4.) Asa result, changes in secondary structure can lead to the formation of disease-associated proteins such as β-amyloids (Soto, et al. Protein Misfolding and Disease; Protein Refolding and Therapy. FEBS Lett 2001, 498,204–207.)
What causes proteins to undergo secondary structural change?
As the secondary structure of a protein is predominantly held together by hydrogen bonding, the root cause of a change in protein secondary structure is always the loss of hydrogen bonding interactions. The hydrogen bonding interactions can be compromised by both intrinsic and external factors. Mutation of the primary sequence during protein expression can cause a loss of hydrogen bonding interactions in the protein secondary structure, leading to misfolding of the protein higher order structure. In addition, external stress such as process temperature, freeze/thaw cycles, ionic strength of the buffer, etc. can also affect the correct hydrogen bonding formation.
What can help us prevent change to protein secondary structure?
The stability of secondary structure of a protein is affected by both its primary structure and the external environment such as buffer, temperature, and pH. To prevent changes to protein secondary structure caused by these factors, proper formulation is often developed so that the hydrogen bonding interactions that stabilize the secondary protein structure can be strengthened. Typical excipients added to the formulation to prevent protein structural change are amino acids, sugars, salts, and surfactants.
Is all structural change in proteins reversible/irreversible?
Structural changes in protein can be either reversible or irreversible. Changes in protein secondary structure are more likely to be irreversible as it is usually associated with loss of hydrogen bonding interactions. One example is beta-amyloid formation, which causes disease-related irreversible protein aggregation. However, lyophilization has been shown to cause reversible changes in protein secondary structure by increasing the beta-sheet content and decreasing the alpha-helix content (Klibanov et al. Lyophilization-induced reversible changes in the secondary structure of proteins. Proc Natl Acad Sci.1995;92(24):10969-76.) In addition, changes in tertiary or quaternary structures are more likely to be reversible. For example, aggregations due to the surface interaction or self-association of proteins that potentially alter the globular structure of the proteins and hence affect their activity or function, can be fixed by changing the formulation to tamper the surface interactions and separate the protein monomers.
Can a change in protein structure occur at all steps of the drug development process?
Yes, protein structural change can occur at all stages of the drug development process, including early discovery, pre-clinical research and development, formulation, and clinical development. Common factors that can cause protein secondary structural change in the early discovery stage include process temperature of proteins, freeze/thaw cycles of proteins, agitation stress of proteins, protein concentration, etc. In the later drug development stage, such as formulation, the goal is to maximize the stability of secondary protein structures by choosing the best excipients and buffers for the proteins.
How is protein structural change detected and measured (tools, etc)?
The tools for measuring protein structure will depend on the level of detail required. Protein primary structure is measured by mass spectrometry, and this would be testing for differences in the amino acids sequence.
Secondary protein structure can be measured by Microfluidic Modulation Spectroscopy (MMS), Fourier-Transform Infrared (FTIR), or Circular Dichroism (CD) and is looking for differences in the fractional contributions of protein structures like alpha-helices and beta-sheets.
Tertiary and quaternary protein structure can be measured with Nuclear Magnetic Resonance(NMR), X-ray crystallography, or Cryogenic-Electron Microscopy (cryo-EM). These tools will give the highest resolution for determining protein crystal structures.
Quaternary protein structure can be measured with sizing techniques such as Size Exclusion Chromatography (SEC) or Dynamic Light Scattering (DLS) and is useful for testing oligomeric states and protein aggregation.
What are the current limitations to detect changes in protein secondary structure
The two legacy tools available for protein secondary structure measurement are CD and FTIR, both of which have some limitations:
CD measures protein structure by probing the chirality, which is a good way for detecting protein secondary structure, however, many small molecules and buffer components will also have chiral features. This makes for many buffering or formulating conditions that have high signal interference and need to be buffer exchanged into a simpler buffer. Additionally, CD is most useful for protein samples at low concentrations (typically < 1 mg/mL), therefore, protein samples formulated at higher concentrations may have to be diluted in order to not saturate the detector.
FTIR, on the other hand, requires protein concentrations that are typically >10-20 mg/mL. This leaves a gap between CD and FTIR and limits each of them from testing under a wide range of formulation conditions without modifying the protein sample in some way. Additionally, FTIR is a very manual workflow, requiring a lot of time.
MMS addresses these limitations by enabling a wide protein concentration range of ~0.1-200 mg/mL with little interference from formulation buffers. MMS has also implemented a fully-automated sample handling system that aids with running the protein samples and analyzing the results.
How do I set up an experiment to find the formulation condition where structure of proteins starts to decline?
One could design an experiment that directly probes the loss in protein stability by performing an accelerated stability study where a protein or biologic is exposed to higher-than-normal stress conditions to help predict when that drug product will fail and gauge the shelf-life and storage conditions. Accelerated protein stability studies involve testing a range of stresses like temperature, agitation, pH, and light exposure.
One example of an accelerated protein stability study using MMS can be seen in the application note titled “Biosimilar Comparison and Accelerated Stability Predictions Based on <2% Secondary Structure Differences Using MMS.” In this study, insulin originator (Humalog) and a biosimilar were compared and the biosimilar was exposed to 4 or 30°C for 8 weeks to determine its structural stability. The data show small protein structural changes due to the heat stress and it is correlated with a loss in alpha-helix,unordered, and turn features, and increase in beta-sheet content. Protein structural tnformation can be useful for stability studies to understand what happens when a protein becomes unstable.
What is the difference between secondary structure prediction and measuring change in secondary protein structure?
Tools like AlphaFold are ground-breaking in their ability to predict protein secondary structure based on the amino acid sequence of a protein or peptide. However, the secondary protein structure can be different depending on the formulation, and tools like AlphaFold currently can’t predict how the environment affects the protein structure. Similarly, it is important to test protein samples experimentally to validate computer simulation results even when they can approximate formulation conditions. These prediction tools are great for screening and minimizing the number of wet-lab candidates that have to be manufactured and screened, but it will always be important to experimentally test the lead protein candidates suggested by simulations.
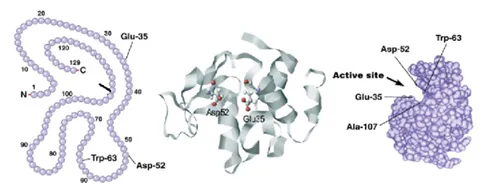
Are bioinformatics used to measure change in protein structure?
Bioinformatics are most often linked to the organism genome and protein primary sequence as opposed to the structure. However, these tools can absolutely be useful in combination with protein structure characterization to help complete the story. For example, the figure below shows how it is possible to link up the primary sequence to the three-dimensional structure. Bioinformatics could help identify evolutionarily conserved regions, like active sites or binding pockets of the protein and therefore, regions of most importance for the protein function.